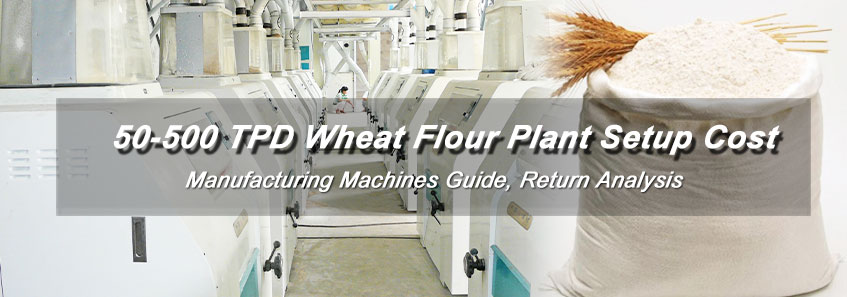
50–500 TPD Industrial Flour Manufacturing Mill Cost-Benefit Analysis
Flour mill setup cost is a decisive factor for investors and engineers planning medium to large wheat flour projects. In flour manufacturing plants ranging from 50 to 500 tons per day, investment decisions must balance plant design, construction cost, operating expenses, and long-term market positioning. (Related Post: 10-50 TPD Small-medium Flour Mill Cost)
Medium & Large Wheat Flour Mill Setup Cost: Investment & ROI Guide
This page focuses on industrial wheat flour manufacturing facilities and provides practical guidance for evaluating setup cost, design logic, and return expectations under real production conditions.

Investment Positioning For Medium & Large Wheat Flour Manufacturing Plants
Medium and large wheat flour manufacturing plants target regional food processors, commercial bakeries, catering chains, and bulk distributors—segments demanding consistent supply, standardized quality, and scalable order fulfillment.
From a market perspective, their positioning hinges on aligning capacity with local/regional demand dynamics:
Wheat Flour Plant Investment Positioning: Emerging vs Mature Markets
-
In emerging markets (e.g., Southeast Asia, Africa), urbanization drives 5–8% annual growth in commercial flour demand, with 100–300 TPD plants ideally serving fast-growing cities needing 50,000–200,000 tons of staple flour yearly.
-
Mature markets (e.g., Europe, North America) prioritize specialty blends (high-protein, organic) alongside staples, favoring 50–150 TPD plants with flexible production lines to cater to niche buyers.
Operationally, a 50 TPD industrial wheat flour plant delivers 8,000–10,000 tons annually (85% utilization), while a 500 TPD facility scales to over 150,000 tons—suitable for countries with abundant wheat supply (e.g., India, Russia) and national-level distribution networks.
From an investment standpoint, flour mill setup costs range from USD 0.5–3 million for 50–200 TPD plants and USD 3–10 million for 200–500 TPD facilities, with economies of scale kicking in for capacities above 150 TPD. Critical to risk mitigation: align capacity with local wheat output (60,000–300,000 tons/year in major producing regions) and market absorption rates—overbuilt plants often operate below 70% utilization in their first two years, delaying ROI.
Market-driven capacity matching is the top strategy to reduce financial risk: Medium-large plants thrive on staple flour products (all-purpose, bread flour) for stable cash flow, while integrating 1–2 specialty lines (e.g., pastry flour for bakeries) to capture premium margins. Localization is key—proximity to wheat sources cuts logistics costs by 15–25%, and adapting to regional taste preferences (e.g., lower gluten content in Southeast Asia) enhances market penetration.
Industrial wheat flour plants of 100–300 TPD strike the optimal balance between capital efficiency and operational flexibility, especially in emerging markets where urban demand is growing but supply chains remain regional.
Define your target market (regional vs. national), core product mix, and supply chain radius early—ABC Machinery delivers tailored flour manufacturing solutions that align with demand, control flour mill setup costs, and accelerate ROI.
2 Key Cost Drivers In Wheat Flour Manufacturing Plant Design
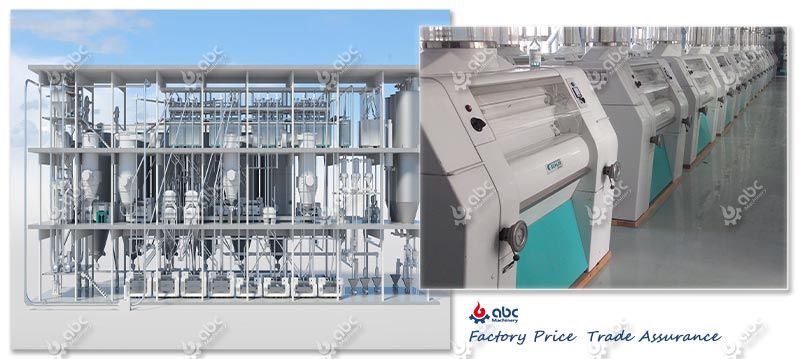
Wheat Flour Mill 3D Layout & Large Grinding Machines
Flour mill setup cost is heavily shaped by wheat flour mill design decisions prior to construction. In most flour manufacturing plant layouts, processing equipment accounts for 45%–55% of total costs, civil works 25%–30%, and installation + utilities 15%–20%.
1. Plant Layout And Process Flow Planning
A compact wheat flour manufacturing plant layout reduces building footprint by 20% vs. dispersed designs. Vertical layouts are standard for 200–500 TPD projects, while horizontal layouts remain preferred below 150 TPD (lower structural height requirements). Poor layout planning can extend material handling distances by over 30 meters per transfer point, driving up construction and long-term maintenance expenses.
2. Wheat Cleaning, Milling And Sifting Configuration

Wheat Flour Plant Layout: Vertical vs Horizontal Process Flow
The wheat flour processing line comprises four core sections: cleaning, conditioning, milling, and sifting. Cleaning systems are typically sized at 110%–120% of rated capacity to ensure stable operation. For a 300 TPD plant, 8–10 break passages and 10–12 reduction passages are standard—directly impacting equipment quantity and steel structure requirements.
|
Plant Capacity |
Typical Building Area |
Main Milling Passages |
Estimated Equipment Share |
|---|---|---|---|
|
100 TPD |
1,800–2,200 m² |
12–14 |
≈48% |
|
300 TPD |
3,500–4,200 m² |
18–20 |
≈52% |
|
500 TPD |
5,000–6,000 m² |
22–24 |
≈55% |
-
Process continuity: Cuts annual downtime by 10%–15%.
-
Space utilization: Optimized layouts lower civil costs per ton by USD 80–120.
-
Maintenance access: Clear service zones reduce maintenance labor hours by 20%.
Wheat flour mill design costs are best controlled when process flow, building layout, and equipment grouping are engineered as an integrated system—rather than isolated sections.
Partner with ABC Machinery’s experienced flour manufacturing engineers to design a wheat flour processing line that controls setup costs without compromising operational stability.
Construction Investment And Operating Cost Return Analysis
A realistic flour mill investment return analysis considers both construction input and long-term operating expenses. Initial construction investment for a 100 TPD wheat flour plant typically falls between USD 2–3 million, while a 500 TPD project may require USD 9–12 million depending on site conditions.
Flour manufacturing operating cost usually includes labor, electricity, routine maintenance, and consumables. Labor accounts for approximately 12%–15% of total cost, while power consumption averages 55–65 kWh per ton of flour produced. Annual maintenance budgets are commonly set at 2%–3% of equipment value.
Simple Profitability Evaluation Logic
A 300 TPD plant operating 300 days per year at 80% utilization produces around 72,000 tons annually. With net margins ranging from USD 25 to 40 per ton, flour plant profitability can generate USD 1.8–2.9 million in gross profit per year. Investment recovery periods typically range from 3 to 5 years under stable wheat pricing.
|
Indicator |
100 TPD |
300 TPD |
500 TPD |
|---|---|---|---|
|
Annual Output |
24,000 t |
72,000 t |
120,000 t |
|
Typical Margin |
USD 30/t |
USD 30/t |
USD 28/t |
|
Payback Period |
4–5 years |
3–4 years |
3–4 years |
Stable utilization rates above 75% are more important than peak capacity when evaluating flour mill setup cost efficiency. Overestimated output assumptions often delay returns by 12–18 months.
Send an inquiry to ABC Machinery for a tailored cost & return model—based on your target wheat supply and sales market—to maximize investment accuracy!
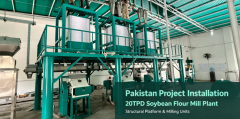
How Flour Milling Project Execution Approach Affects Cost And Schedule
Project execution strategy directly impacts wheat flour plant construction costs and commissioning timelines—misalignment between design, equipment supply, and installation creates costly inefficiencies. When these phases are managed separately, project duration typically extends 3–6 months, 3–6 months, driving indirect costs up by 8%–12%.
In contrast, coordinated execution streamlines workflows: 200–300 TPD plants complete installation in 8–12 months, with tighter alignment between equipment layout and civil works. This reduces rework (a major cost driver), avoiding the USD 50–100 per ton premium otherwise added to flour mill setup cost.
Select a project delivery model that prioritizes coordination and accountability—ABC Machinery’s turnkey solutions protect your budget and startup schedule.
Flour mill setup cost is foundational to successful flour manufacturing projects. By integrating capacity planning, wheat flour mill design cost control, operational expense visibility, and coordinated execution, investors and engineers build competitive plants with predictable returns and long-term operational stability.
- Single Flour Milling Machine
- Small Scale Flour Mill
- Large Scale Flour Mill
- Storage Silos
- Pneumatic Grain Conveyor


- Small Maize / Corn Flour Mill Machinery Design and Layout
- How to Choose a Reliable Small Wheat Grinding Machine Sale?
- How to Set Up Your Own Mini Wheat Flour Milling Plants at Home?
- Soy Protein Isolation Production Line Cost
- Cost of Setting Up A Soybean Isolate Protein Plant
- Characteristics And Application of Soy Protein Isolate
- How to Maintain Your Own Home Flour Mill Equipment
- How to Make Maize Flour at Home